SMC + Dual UT Bot buy and sell AlertsMise a jour avec un EMA 20/50 et vwap
his script is a composite indicator for TradingView (Pine Script v5) that merges Smart Money Concepts (SMC) with a Dual-instance UT Bot. It has been styled with a high-contrast "Neon Cyberpunk" theme (Cyan/Pink) and is fully compliant with the CC BY-NC-SA 4.0 license.
Here is a breakdown of its two main components:
1. Smart Money Concepts (SMC)
This portion, originally by LuxAlgo, is designed to identify institutional price levels and structural market shifts. It provides a detailed map of market structure rather than simple entry/exit signals.
Market Structure (BOS & CHoCH):
BOS (Break of Structure): Marks trend continuation (e.g., breaking a higher high in an uptrend).
CHoCH (Change of Character): Marks potential trend reversals (e.g., the first time a higher low is broken in an uptrend).
Order Blocks (OB):
Highlights specific candles where institutional buying or selling likely occurred. These act as high-probability support/resistance zones.
Neon Blue/Cyan for Bullish OBs.
Neon Pink for Bearish OBs.
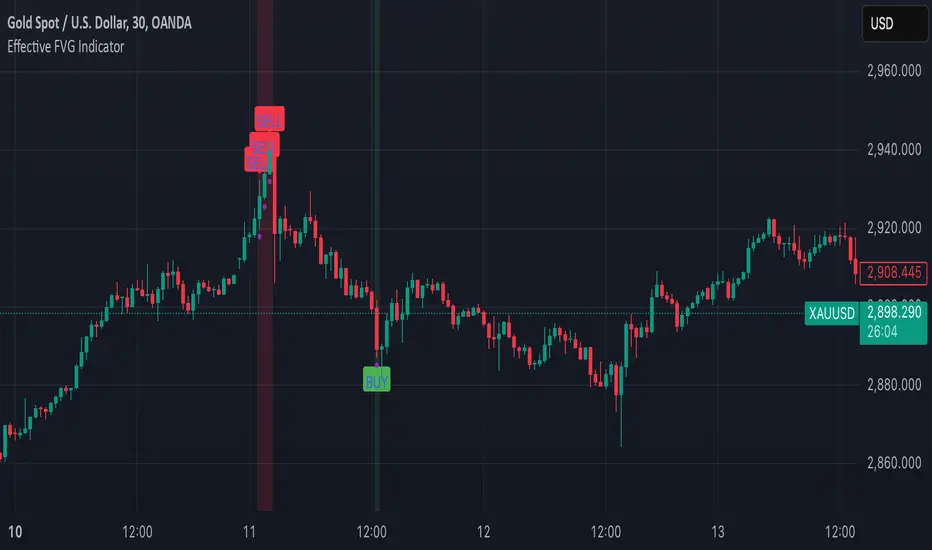
Fair Value Gaps (FVG):
Identifies imbalances (gaps) in price action where the market often returns to "fill" orders.
Neon Mint for Bullish FVGs.
Neon Red for Bearish FVGs.
Premium/Discount Zones: Automatically plots the range equilibrium (50% level) to help you buy in "Discount" (low) and sell in "Premium" (high) areas.
Liquidity (EQH/EQL): Automatically detects "Equal Highs" and "Equal Lows," which are magnets for price as they represent liquidity pools (stop losses).
2. Dual UT Bot Alerts
This portion provides the actual Entry Signals. It runs two separate instances of the "UT Bot" strategy simultaneously with different sensitivity settings to filter noise.
Instance 1 (Buy Only):
Settings: Key Value = 4, ATR Period = 10 (Faster, more sensitive).
Visual: Plots a Neon Cyan "Buy" label.
Function: Looks for bullish reversals earlier to catch the start of a move.
Instance 2 (Sell Only):
Settings: Key Value = 7, ATR Period = 20 (Slower, smoother).
Visual: Plots a Neon Pink "Sell" label.
Function: Uses a wider ATR band to avoid getting shaken out of shorts too early, focusing on major downtrends.
How to Use It
The strength of this script is confluence.
Wait for a Signal: Look for a UT Bot "Buy" or "Sell" tag.
Confirm with SMC: Check if the signal aligns with SMC concepts.
Example Buy: Did the UT Bot give a "Buy" signal while price was bouncing off a Bullish Order Block?
Example Buy: Did price just sweep Liquidity (EQL) before the Buy signal?
Example Sell: Is the "Sell" signal happening inside a Premium Zone or a Bearish Fair Value Gap?
avant-hier
Notes de version
1. "Pro" Badge Buy/Sell Labels
The standard text signals have been replaced with modern, professional Badge Labels that provide more information at a glance.
Visuals: Instead of simple text, the script now uses label.new to create high-visibility badges.
BUY: A Neon Cyan badge with a Rocket icon (🚀).
SELL: A Neon Pink badge with a Chart icon (📉).
Price Details: Each badge displays the exact Entry Price directly on the label.
Tooltips: If you hover your mouse over a Buy or Sell badge, a tooltip will appear showing the exact Take Profit (TP) and Stop Loss (SL) prices calculated for that trade.
2. Dynamic Take Profit (TP)
The script now automatically calculates a profit target for every trade the moment a signal is generated.
Calculation: It measures the distance between your Entry Price and the initial Stop Loss (the ATR Trailing Stop).
Risk:Reward: It multiplies that distance by your chosen Risk:Reward Ratio (default is 1.5) to project a TP target.
Visual Line: A Green Line is drawn on the chart at the TP level. It remains active until price hits it or the stop loss.
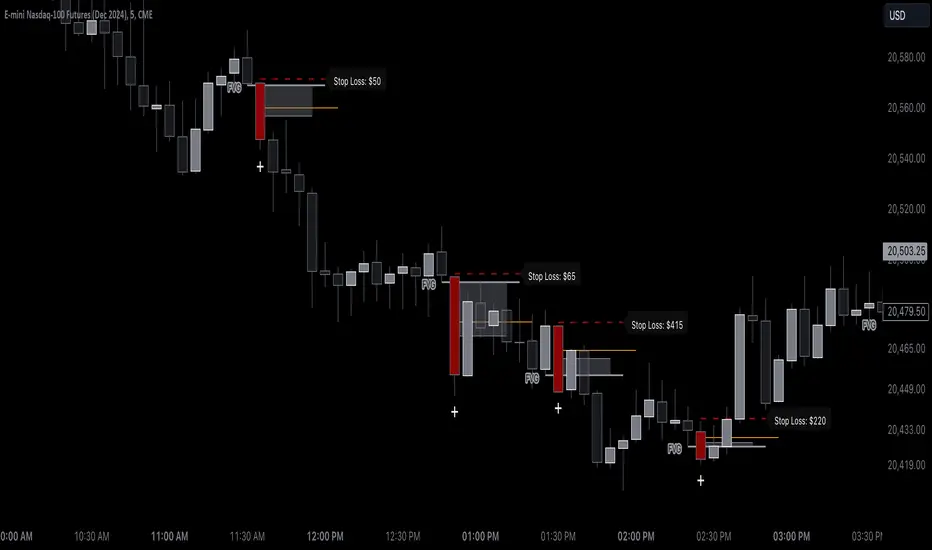
3. Active Trailing Stop Loss (SL)
The Stop Loss is no longer static; it is now "alive" and manages the trade for you.
Trailing Logic: If Use Trailing SL? is enabled (default), the SL line will automatically move up (for longs) or move down (for shorts) as the trend continues in your favor. It locks in profit by following the UT Bot's ATR trailing band.
Visual Line: A Red Line is drawn at the SL level. You can see it physically step up or down on the chart as the trend progresses.
4. Real-Time Trade Simulation
The script now simulates the lifecycle of a trade directly on the chart:
Active State: When a trade is live, the TP and SL lines extend to the right of the current candle (bar_index + 1), showing you exactly where your exit points are in real-time.
Closed State: Once the price hits either the Green TP line or the Red SL line, the script detects the "Exit." The lines stop extending and turn dotted, indicating that the trade is closed and waiting for the next signal.
Summary of New Settings
You will find a new group in the settings panel called "UT Bot: Trade Management":
TP Risk:Reward Ratio: Adjust this to change how far the Green TP line is placed (e.g., set to 2.0 for 2x return).
Use Trailing SL?: Uncheck this if you want the Red SL line to stay fixed at the initial entry risk level.
avant-hier
Notes de version
1. Live Strategy Performance Dashboard (Backtester)
Since this is an indicator, TradingView does not automatically calculate PnL (Profit and Loss). I have built a custom Simulation Engine inside the script that tracks every UT Bot signal as if you had taken the trade.
Location: Bottom Right of your chart.
Win Rate: Displays the percentage of trades that hit the Take Profit target versus the Stop Loss.
Trades (W/L): Shows the total number of signals generated, broken down by Wins and Losses.
Net Profit (R): Calculates your theoretical profit in "R-Multiples" (Risk Units).
Example: If you set your Risk:Reward to 2.0, every win adds +2R, and every loss subtracts -1R.
Dynamic Colors: The Win Rate and Profit cells turn Neon Cyan if positive (>50% or >0R) and Neon Pink if negative.
2. Multi-Timeframe Trend Dashboard
A new panel at the Top Right gives you an instant "Market Bias" reading so you don't have to scan the whole chart.
SMC Trend: Reads the Smart Money structure (Break of Structure/Change of Character) to determine if the high-level timeframe is BULLISH or BEARISH.
UT Bot Status: Displays the current active signal state:
BUY (Active): You are currently in a Long trade.
SELL (Active): You are currently in a Short trade.
NEUTRAL: No active signal or the last trade hit TP/SL.
3. Integrated Alert System
I have connected the visual lines to the alert system. You can now set a single alert on this indicator, and it will trigger for:
Entry Signals: "UT Long Entry" / "UT Short Entry"
Exits: "Take Profit Hit" / "Stop Loss Hit"
4. Consolidated Settings
To make the script easier to manage, I organized the settings into clear groups:
Dashboards: Toggle the visibility of the new panels or move the Performance Panel to a different corner.
UT Bot: Trade Management: Quickly adjust your Risk:Reward Ratio (e.g., change from 1.5 to 2.0) to see how it affects your Win Rate in real-time on the dashboard.
avant-hier
Notes de version
1. Multi-Timeframe (MTF) Trend Scanner
I have replaced the basic "Market Bias" panel with a comprehensive MTF Trend Dashboard located at the Top Right of your chart.
What it tracks: It simultaneously monitors the trend direction on 5 distinct timeframes:
15 Minute
1 Hour
4 Hour
Daily
Weekly
How it works: It runs a background calculation (using UT Bot settings Key=5, ATR=15) on these higher timeframes without you needing to switch charts.
Visuals:
BULLISH: Highlighted in Neon Cyan.
BEARISH: Highlighted in Neon Pink.
2. Strategic Confluence (How to use it)
This new dashboard transforms the script from a simple "signal generator" into a complete trading system by allowing you to filter trades based on the bigger picture.
The "All-Green" Rule: If you are scalping on a 5-minute chart and you get a BUY signal, check the dashboard. If the 1H, 4H, and Daily are all Neon Cyan (Bullish), that trade has a significantly higher probability of success.
Avoid Counter-Trend Trades: If your main chart says BUY, but the dashboard shows the 4H and Daily are Neon Pink (Bearish), you are trading against the major trend. You might want to skip that trade or reduce your risk size.
3. Summary of Dashboards
You now have two professional-grade panels on your screen:
Bottom Right (Performance): Shows the past results of the strategy on your current timeframe (Win Rate, Profit Factor).
Top Right (Trend): Shows the current state of the market across all timeframes.
อินดิเคเตอร์ Pine Script®